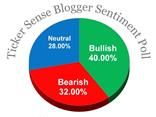
My prediction for today was wrong, though not by much. Nevertheless, down 13.68 is still not up. In any case, today's low-volume doji (I hesitate to call it a shooting star after being wrong on that twice last week), and the late night futures headed lower suggests a reversal may be at hand and that tomorrow will be a down day.
Last trade: went long AUY at 10.17 late this afternoon.
Tuesday, March 9, 2010
Monday, March 8, 2010
Watching Gold
I like to follow gold (who doesn't) and my favorite gold play is AUY, Yamana Gold, a Canadian miner. Why AUY? Mostly because it's a lot cheaper than GLD or the other miners, but not too cheap. It also has a reasonable P/E of around 22.5. I can afford to add to positions in AUY that I couldn't do otherwise. At 10.19 right now, I'm watching it closely because I think it may be a buy by tomorrow:

AUY has established some pretty decent support at 10.00 going back to last September. 10 is also the lower Bollinger band. It topped three days ago and has been falling steadily since then. As it falls, volume is decreasing. Eventually, we will run out of sellers and it will start back up again. The stochastic (lower indicator) is also approaching levels associated with a bottom. I'll be looking to get into AUY pretty soon.
Disclaimer: I currently hold no position in AUY, though I do trade it regularly.
Dow Forecast for 3/8/10
The Dow closed last week at 10,566. Right now, at 1:15 AM EST, all three futures are up and Asia closed higher. After some indecision last Tuesday and Wednesday, the market put in two strong up candles on Thursday and Friday. With the euro back in an uptrend and with 795 new highs being hit last Friday compared to 38 new lows (across the broad market), I can't help but call tomorrow's close higher.
I note also that there is no resistance until 10,600 and the upper Bollinger band is at 10,615. If we crack that, we're due to revisit the early January highs. Last week's close nearly totally erased the sickening slide from 1/20 to 2/05.
I note also that there is no resistance until 10,600 and the upper Bollinger band is at 10,615. If we crack that, we're due to revisit the early January highs. Last week's close nearly totally erased the sickening slide from 1/20 to 2/05.
Sunday, March 7, 2010
Tracking Performance
Trading, as Dr. Brett Steenbarger often says, is a performance activity. And you need some sort of metric to tell how good your performance is. I'll admit that for the first couple of years I was trading, I just bought and sold stuff without really keeping track of how I was doing. Needless to say, that wasn't the best way to go about it.
I'm a lot more rigorous now. I keep a trading journal, a performance log, and a trading diary (this blog). Here's the items I track on a daily basis in my performance log:
Date Dow close Dow daily change Daily Dow %
Tot. invested Daily change Daily % ROI Trading Balance
Tot. Week Wk. pct. Return Pct. Cash excl. bonds
Tot. Month Mo. pct. Change YTD % total return
Dow YTD % return Daily perf rel to Dow
Bonds Deposits / withdrawals
Tot. Year Monthly commission No. of realized wins No. of realized losses
Mean win size Mean loss size
Last week was my best since the beginning of the year. I was up 1.8% on the week. This puts me up 2.13% year-to-date in my trading account. This was particularly gratifying since I'd gotten hammered with five consecutive losing weeks beginning in mid-January.
One item I watch closely is my performance relative to the Dow. So far, I'm outperforming the Dow by 16% YTD. My primary performance goal is to at least match the performance of the Dow. If I can't do that, I might as well just put all of my money in the DIA.
Subscribe to:
Posts (Atom)


