Friday, February 24, 2012

Tough call - Friday might go higher

The Hoot 
Actionable ideas for the busy trader delivered daily right up front
  • Friday higher, low confidence.
  • ES pivot 1359.00.  Holding above is bullish..
  • Next week bias uncertain technically.
  • Monthly outlook: bias up.
  • ES Fantasy Trader standing aside.
Recap

Once again the market did not really move the way I expected today, though I did point out that I had some doubts about calling today lower. Instead, the Dow continues to bump up against the 13K line, being unable to cross it so far.  Much has been made recently about the last time we visited this level, back in May of 2008.  But there's one big technical difference.

Back then, the 200 day MA was also right at 13K, providing a sort of double barrier.  The Dow made two attempts to cross 13K in May '08 and then just gave up.  Of course, there were also some major fundamental economic differences back then, but technically, today's chart is in a different place.  First we're considerably above the 200 day MA now and second, instead of taking one quick stab at 13K, we're in a period of consolidation right below it.


I'm also hearing a lot of talk about how a big pullback is imminent, and I'm as guilty as anyone, having painted a gloomy picture just last night.  Now, I'm not so sure.  Read on...
The technicals

The Dow: Our friend the Dow seems to be back in the same mode it was in earlier this month, only now at a slightly higher level - alternating up-down days featuring a variety of reversal candles that don't reverse.  Indeed, we seem to be continuing the stair step advance pattern in place since last December.  Every time we level out for a few days, it gets people thinking the rally is over and we're about to get a pullback - and then the market takes a quick move higher, where the process repeats.

I note too that the stochastic bearish crossover I saw last night unknotted itself today and now is looking more thready and therefore useless as a predictor of anything.

The VIX:  The VIX blew right through its recent support at 17.75 to finish down 7.6% today on a long solid red candle.  It closed on its last support point at 16.80 and is now back in its descending RTC.  The upside move of last week was more of a fake-out than a breakout.  Today's close was the lowest since early last July.  The VIX now has no support until 16.49, the lower BB, and then 15.30.  I see nothing in either the daily VIX or futures to suggest a reversal on Friday, though next week might be a different story.

Market index futures: At 1:35 AM EST, all three futures are up with ES leading the way, gaining 0.17%.  While we did not hit 1369 today, as I figured last night, today's green candle could be taken as both a hammer and a bullish engulfing pattern.  A chart that was looking pretty poor last night isn't looking so bad tonight.  And the lack of negative follow-through in the overnight diminishes the bearish case.

ES daily pivot: Bumped up a bit from 1357.67 to 1359.00 tonight.  After rising all evening, we remain six points above the new number, which is a good sign.

Dollar index: The dollar continues in a somewhat erratic downtrend.  It's now close to support and its lower BB, but not quite there yet.  Although it put in a star today, we could see at least a bit more downside here on Friday.

Morningstar Market Fair Value Index: Yesterday the index extended its streak at 0.96 to four straight days.  The last time we had a streak at this level ended on February 9th at 5 days.  The 10th was down.


Meanwhile, speaking of streaks, the SPX Hi-Low index was stuck on 100 for eight straight days now.  That's quite unusual without a pullback.


History: According to The Stock Traders Almanac, this Friday is historically the weakest day of the week, decidedly bearish.

     And the winner is...

Yet another tough call.  Last night I was feeling pretty negative and it didn't happen today.  This market continues, for the time being at least, to be able to shake off bad technicals.  I still think a pullback is coming but right now it's not looking like it will happen on Friday, especially not with the VIX in decline and now below 17.  So instead, I will call for a slightly higher close on Friday, but once again, I don't have a lot of confidence here - the signals are just not that clear right now.

ES Fantasy Trader

 I said last night that I had a bad feeling about this trade.  That prompted me to close it out right at the open for a one point profit, figuring I'd better get while the getting was good.  I'm glad I did, since the market began rising shortly thereafter.

Tonight I'm simply chickenig out.  While I think we may go a bit higher tomorrow, I'm not confident enough to put on a big ES trade and I'm still not liking the risk/reward ratio at these levels.  Nothing ventured, nothing lost.

The account is now $113,250 after 15 trades (12 wins, 3 losses) starting from $100,000 on 1/1.

BOT    10    ES    false    MAR12 Futures     1353.50    USD    GLOBEX    09:30:38
SLD    10    ES    false    MAR12 Futures     1354.50    USD    GLOBEX    FEB 22 20:57:07   

 

Thursday, February 23, 2012

Thursday unclear, maybe lower

The Hoot 
Actionable ideas for the busy trader delivered daily right up front
  • Thursday lower, low confidence.
  • ES pivot 1357.67.  Holding below is bearish..
  • Rest of week bias lower technically.
  • Monthly outlook: bias up.
  • ES Fantasy Trader goes short at 1353.50.
Recap

Aside from the small range, today did not really pan out as I had expected.  I'm starting to get a feeling of existential malaise in the markets, and that was only reinforced by some rather sharp observations from alert reader Daniel in a comment to yesterday's post, which I strongly encourage all my readers to check out.  Let's see if the technicals support these ideas.

The technicals

The Dow: In dropping 27 points today, the Dow formed something close to a bearish engulfing pattern.  Today's red candle can also be viewed as bearish confirmation of yesterday's star.  On the indicator side, while RSI is just short of overbought, OBV hit its highest level of the year yesterday and moved lower today..  Money flow also declined today.  And the stochastic is right on the cusp of a bearish crossover.  This is a chart that's looking ready to go lower.

On top of this, the SPX Hi-Low indicator has now been pegged at 100 for seven straight sessions.  That's really looking overdue for a pullback.

Daniel made some comments about $TRAN, the Dow transport index.  This has actually been in decline since February 6th.  However, the Dow itself has not followed suit.  Not yet anyway.  Compare this situation to the second half of last November when the Dow and $TRAN both declined in lockstep.  Something's up here.

The VIX:  After a gap-up open, the VIX then meandered lower to close exactly unchanged, at 18.19 on the dot.  The failure of the VIX to advance could be taken as a non-confirmation of yesterday's star, meaning it could go lower on Thursday, which would be good for stocks.  At the same time, the VIX has found some good support at 17.75, so it's possible it could bounce off that level and then move higher.  Who knows.  The stochastic is now in a position from where a reversal (ie. a move higher) usually occurs in about two days.

Market index futures: Very little guidance from the futures tonight.  At 1:56 AM EST we've got ES flat, NQ up 0.12% and YM up just 0.05%.  However, today's red candle did take us out of the rising RTC for a bearish setup.  ES would have to trade up to 1369 Thursday to get back in.  A failure to hit that number (and I don't think we're going to see 1369) would be a bearish trigger.  In addition, the indicators have now all peaked at overbought levels and are headed lower.  The stochastic completed a bearish crossover today.  None of this is particualrly good news for stocks.

ES daily pivot: Tonight the pivot dropped from 1361.75 to 1357.67.  However, even with that, ES continues to run under the new value, though little changed all evening.  In any event, holding under the pivot is bearish and I see no sign, at least not as of this writing of an attack on it.

Dollar index: The dollar is another chart that did not move the way I expected today, finishing up 0.21% rather than continuing down.  But it did it on a red candle.  We now have two red stars in a row.  With this sort of indecision, I can't really draw any conclusions.  It's really more reflection of the continuing mess in Europe.

Copper: One item Daniel mentioned a while back but not today is copper.  Copper broke out of a declining RTC two days ago, the same day it also climbed back above its 200 day MA.  These both seem to suggest higher copper, which would be good for stocks.

Morningstar Market Fair Value Index: Yesterday the index remained at 0.96 for the third day in a row.  The failure of the index to continue advancing is of concern.

History: According to The Stock Traders Almanac, Thursday is historically actually slightly bullish, the best day of this week

     And the winner is...

There's a fine line between looking at too little data and too much data.  The former leaves you open to poor decision making and the latter just drives you mad.  Right now, I'm looking over my shoulder for the men in the white coats.  Something's up.  To quote noted stock market guru Buffalo Springfield, "There's something happening here, what it is ain't exactly clear".

I'm now seeing signs of a reversal lower everywhere, and yet in the time it took me to write this, ES suddenly jumped from 1355 at 1:40 AM to 1357 at 2:06 AM.  Five straight solid green five minute candles.  And I don't see anything on the news wires to explain it.  This is causing the new ES candle to look like a classic hammer

But since I really hate writing all this stuff and in the end coming to no conclusion, I will move waaay out to the very end of the limb and claim that, given the preponderence of evidence from the charts, Thursday's looking lower, not withstanding this disturbing sudden pop in ES (or the fact that J-Trader is going long).

ES Fantasy Trader

After standing aside yesterday, tonight I went short at 1353.50 at 8:57 PM,  a decision I'm starting to regret.  But you never know,  it may work out in the end.

The account remains  $112,750 after 14 trades (11 wins, 3 losses) starting from $100,000 on 1/1.
 

Wednesday, February 22, 2012

More small gains possible Wednesday

The Hoot 
Actionable ideas for the busy trader delivered daily right up front
  • Wednesday slightly lower, low confidence.
  • ES pivot 1361.75 .  Holding above is bullish..
  • Rest of week bias lower technically.
  • Monthly outlook: bias up.
  • ES Fantasy Trader standing aside.
Recap

Well I said it would be an interesting week and so far it's sure looking that way.  The Dow sent out no fewer than four separate patrols to scout out the 13,000 front around mid-day, but apparently none of them liked what they saw and they were unable to find a break in the enemy's lines.  Will they launch a full-scale assault tomorrow, or order a tactical retreat?  Let's call HQ and see if we can get some orders.

The technicals

The Dow: Today's 16 point gain not only hit the 13K line intraday but also the upper BB at 13,005 to form a star.  However, I don't think this indicates indecision as much as a massing of the troops in preparation for the next attack.  The daily indicators are still not overbought, so given the continuing upward bias I'd be hesitant to call this star a negative sign.

The VIX:  Meanwhile the VIX put in a star of its own, actually rising 2.3% from yesterday's close but down from today's open.  This one could go either way, but the VIX futures seem to be leaning more towards at least a bit lower on Wednesday which would be good for stocks.

Market index futures: Tonight all three are in the green with ES up 0.17% at 1:30 AM EST.  Despite this, today's ES chart is showing some signs of an impending reversal, in the form of a dark cloud cover, overbought indicators, and a stochastic just executing a bearish crossover.  In addition, ES just exactly touched its upper BB today.  Tonight's positive action is coming off the lower end of the daily candle.  I'm seeing more risk than reward on this chart right now.

ES daily pivot: Rose again from 1358.00 to 1361.75 tonight.  This briefly put ES below the pivot right at midnight, but then it broke through and seems to be slowly drifting higher, a positive sign.

Dollar index: The dollar continued a three day decline today and its indicators suggest more room to run lower Wednesday, implying higher stocks.

Morningstar Market Fair Value Index: Morningstar's chart is all screwed up today.  The number they're showing is 0.83 which is obviously wrong, and the chart doesn't go past the 17th.  How hard can it be to update this?

History: According to The Stock Traders Almanac, Wednesday is historically slightly better than Tuesday, but still bearish..

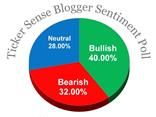
Sentiment: It's the start of a new week so once again it's time for the TickerSense Blogger Sentiment Poll.  We continue to track the poll to see how well it performs.  Here's the updated cumulative list for this year:


Wk.# Week   % Bullish  % Bearish  NightOwl SPX  Accuracy

  1   1/3        46         21        +    1258    1/1
  2   1/9        56         37        +    1278    2/2
  3   1/17       41         33        +    1289    3/3
  4   1/23       46         32        +    1315    4/4
  5   1/30       48         31        +    1316    5/5
  6   2/6        56         30        +    1345
  7   2/13       48         31        +    1343
  8   2/21       44         32        +    1361

Again, the SPX number is the closing price of the S&P on the Friday before each new poll comes out.  The "NightOwl" column is how I voted.  Since the poll is for 30 days out, after the first four weeks we're able to see how well we did.  This week we see that my bullish call on 1/30 was correct, the S&P now being higher than then.  I'm using the column "Accuracy" to track my calls.  So now I'm 5 for 5.  And of course that means that since I voted with the majority back then, the poll as a whole was also correct that week.  After five straight weeks of being correct, the contrarian "majority is always wrong" theory is really looking bad.  The Ticker Sense bloggers are batting 1000.

Interestingly, this week's numbers were little changed from last week.  The bulls came down four points and the bears barely budged from the 30-33% band they've been in since the third week of January now.  But I do note that bullish sentiment is on the wane, having declined now for the third straight week.  This makes me think that we could be in for a pullback sometime in the next few weeks.  I note too that the SPX Hi-Low index has now been pegged at 100 for six straight sessions.  It rarely goes this long without a down day following.

     And the winner is...

Another hard one.  I'm seeing both positive and negative signs in the charts.  The SPX weekly chart is now looking quite overbought, and right about the same levels as the highs of last year in May.  We do remain inside the rising weekly RTC though for the time being.  Meanwhile the daily Dow and SPX charts still look like they have some upside left.  Add in that the futures are up, the VIX remains below 20, and there seems to be relative calm on the European front at least temporarily, I'm going to go out on a limb and guess that we just might see some more small gains on Wednesday.  But I'm definitely getting more cautious and not looking to put any money to work at these levels for the time being.  I'm starting to not like the daily ES chart.

ES Fantasy Trader

My decision not to jump in last night was correct.  The big weekend pop we had in ES on the Greek news was all over by the time I got around to it, and even though ES ended the day higher, it was still below the level I was looking at in the overnight trying to find an entry point.

Tonight we do not trade again, as I still don't see an edge for me.  No point just guessing. We're working the market, not playing it.

The account remains  $112,750 after 14 trades (11 wins, 3 losses) starting from $100,000 on 1/1.
 

Tuesday, February 21, 2012

Tuesday higher

The Hoot 
Actionable ideas for the busy trader delivered daily right up front
  • Tuesday higher, medium confidence.
  • ES pivot 1366.08 .  Holding above is bullish..
  • Rest of week bias uncertain technically.
  • Monthly outlook: bias up.
  • ES Fantasy Trader standing aside - entry missed..
Recap

Last Thursday I wasn't quite sure what to make of Friday, expecting a small range doji.  Well we got a small range, with the Dow gaining just 46 points, but it was in the form of a solid green candle.  With a holiday-shortened week ahead, let's see if the technicals can give us a clue as to where we might be going on Tuesday.  With Greek news coming up, it should be an interesting ride.

The technicals

The Dow: Technically, Friday's advance gave no indications of a possible reversal.  In fact, the stochastic completed its bullish crossover on increased volume.  With the upper BB at 12,982 and the psychological 13K level still a bit above us, there's still a bit more room to run before encountering any resistance.

The VIX:  After spending a few days above its descending RTC last week, the VIX dropped right back into it on Friday., losing 7.49% on a second solid red candle.  Its indicators are all in solid declining mode right now too and the lower BB is at 16.81, intimating that we still have close to another point lower to go before a reversal.  We're getting there, but not quite just yet.

Market index futures: The only real guidance we have for Tuesday comes from the futures, which did trade for a while yesterday and today.  And the futures seem to be liking the news out of Europe.  With the announcement of the Greek deal earlier this evening, the futures are all running higher at 1 AM EST with ES up half a percent.

But that still leaves us right around the level from Sunday's open, suggesting that this news was already baked in yesterday.  The US holiday is messing with the charts a bit, but this action is obviously good news.  The only bad news is that I'm now looking at two gap-up stars on the daily ES, and that's a potential reversal.  But being as they came on weekend trading, you have to take them with a grain of salt.


ES daily pivot:Jumped from 1358.00 to 1366.08 tonight.  Despite some up and down over the last two days, we were above the old number and just broke through the new number, another positive sign.

Dollar index: The dollar is pretty much hostage to the euro right now.  And with the big pop the euro took on the Greek news, you can be sure the dollar's going lower on Tuesday, which ought to be good for stocksd.

Morningstar Market Fair Value Index: On Friday the index remained at 0.96 , the same high point it's reached all month.  I'll be looking for it to rise some more to be considered bullish on Tuesday.


History: According to The Stock Traders Almanac, the day after Presidents Day is historically rather bearish.

     And the winner is...

With the European markets applauding the Greek developments and the euro headed higher, I can't really see our market going lower on Tuesday.  The Dow now clearly seems to be gearing up for an assault on 13,000.  I wouldn't be surprised to see that number tomorrow, though perhaps not closing there just yet.  All in all though,m I'm reasonably confident we'll see a higher close Tuesday.

ES Fantasy Trader

 Unfortunately, I missed the major move in ES that happened right at the open on Sunday, so I'm just going to stand aside tonight.  I think most of the money has already been made on this trade.  But that's OK - the market is like a bus - there's always another one coming along you can jump on.

The account remains  $112,750 after 14 trades (11 wins, 3 losses) starting from $100,000 on 1/1.