Friday, July 20, 2012

Friday lower

The Hoot 
Actionable ideas for the busy trader delivered daily right up front
  • Friday lower, low confidence
  • ES pivot 1371.33.  Holding under is bearish.
  • Next week bias lower technically.
  • Monthly outlook: bias down.
  • ES Fantasy Trader going short at 1367.75.
Recap

Last night I called Thursday higher, but added "I'm not expecting a really big up day."  I'd say today's 35 point gain in the Dow qualifies.  What surprised me about today was that we were up at all, considering that all of today's economic news came out worse than expected.  With options expiration tomorrow, Friday should be interesting.

Olympic reminder: With the Olympics starting next week and running for two weeks, the Night Owl is planning on taking some time off to watch the spectacle on TV.  Mr. Market is pretty much in the summer doldrums right now, so I don't think we'll be missing much.  Regular posting will resume after the closing ceremonies.

The technicals

The Dow: Last night I mentioned the importance of the 12,950 resistance line.  The Dow tried and failed to break through this level today.  While we did get a third green candle in a row, today's gain was the smallest so far.  The indicators also continued to move into overbought territory and the stochastic continued setting up for a bearish crossover that could happen on Friday.  We now have three closely spaced resistance points ahead of any further gains: the aforementioned 12,950, the psychological 13K even and the upper BB at 13,011.  This could be a tall order to fill.

The VIX:  Meanwhile, the VIX continued its slide today losing another 4.39% to close at 15.45, a level that has now hit oversold.  However, the VIX remains in its descending RTC and the lower BB is falling away, now down to 15.12.  As I've mentioned often, the VIX is pretty good about respecting the lower BB and we're pretty close to it now.  I'd say we're near the point where the VIX will start rising again, probably in a day or two.

Market index futures: All three futures are now in the red with ES down by 0.33% at 1:07 AM EDT.  While today ES did form a third consecutive green candle to give us a bullish three white soldiers pattern, I think these soldiers are a little battle-fatigued as the action in the overnight has already just about completely retraced the gains of the day.  The stochastic is also within a hair of making its bearish crossover.  And both RSI and money flow have now turned lower from overbought.  This all suggests a chart ready to roll over.

ES daily pivot: Tonight the pivot rises from 1363.42 to 1371.33.  With the overnight drop in ES and the jump in the pivot, we crossed under right at midnight and ES has given no indication of wanting to move higher since then, not a promising sign.

Dollar index: We got a gap-down inverted hammer from the dollar today as it lost another 0.26% and dove into oversold territory.  It stochastic is also setting up for a bullish crossover, probably on Friday.  Interestingly, the euro did not move higher today, canceling its ascending triangle pattern.  If anything, it looks ready to move lower now with it stochastic having just formed a bearish crossover.  This would be bad for stocks.

Transportation: More interesting developments in the trans today.  While the trans gained 0.91%, the Dow was up only 0.27%.  You'd think that would indicate a bearish divergence.  But yesterday I was thinking that the trans might go lower today.  Instead, the developing bearish stochastic crossover was completely short-circuited  When the stochastic starts threading like this, it indicates consolidation or at least a temporary halt to the current trend.  It's also a bit concerning that the trans tried but failed to cross resistance at 5190 today.  None of this guarantees lower on Friday, but it at least calls into question whether we can put in a third day in the green.

Accuracy (daily calls):

Month right  wrong  no call  conditional  batting   Dow
                                          average  points trade

April   7      9      2                    .438
May    10      7      3           2        .632
 
June    8      6      6           1        .600     632   +$330
July    8      0      4           1       1.000     616

     And the winner is...

I think we're nearing the short-term top I've been waiting for all week.  In fact, in addition to going short in the ESFT tonight, I took on some SDS at 15.19 in my trading account today as a hedge.  Oh, and although the TLT moved lower again today, it put in a morning star doji today, usually a good reversal indicator.  And a higher TLT would mean lower stocks.  The one outlier is Dr. Copper, who's actually in pretty good shape right now.  But everyone else is looking toppy, and the Dow is down 7 of the last 11 op-ex Fridays, so I'm calling Friday lower.

ES Fantasy Trader

Portfolio stats: with no trade again last night the account remains at $160,625 after 51 trades (40 wins, 11 losses) starting from $100,000 on 1/1/12.  Tonight we go short at 1367.75.  If this trade is not profitable on Friday, I believe it will be on Monday.  Reminder - you can follow these trades live on Twitter @nightowltrader.  I won't flood your feed either - we're averging just under two trades a week so far this year.

CUA (Commonly Used Acronyms)

BB - Bollinger Bands
DCB - Dead Cat Bounce
MA - Moving Average
RTC - Regression Trend Channel
YTD - Year To Date

Disclaimer: (My lawyer made me do it) This blog is not trading or investment advice, account management or direction.  All trades listed here are presented only as examples of the author's personal trading style.  Investing entails significant risk and trading entails even greater risks.  Deal with it.


Thursday, July 19, 2012

Thursday maybe a bit higher

The Hoot 
Actionable ideas for the busy trader delivered daily right up front
  • Thursday higher, low confidence
  • ES pivot 1363.42.  Holding above is bullish.
  • Friday bias uncertain technically.
  • Monthly outlook: bias down.
  • ES Fantasy Trader standing aside.
Recap
Last night I made one of my infrequent conditional calls, claiming that the pivot would be the key to today's close.  If anyone still doubts the Power of the Pivot, check out this chart of 5 minute ES candles in the early Tuesday morning overnight.

ES, 5 minutes
The vertical red line is when I was writing last night's post around 1:30 AM  Notice how ES got really close to the pivot but bounced off and then rose until 4:30 AM.  Then like a moth to a  flame, it was attracted again and exactly touched the pivot at 6 AM - before bouncing off again.  Then again at 7 AM..  And finally one last concerted attack with the bears growling and clawing for all their worth when between 8:40 AM and 9:15 AM, the pivot was touched on six of eight 5 minute candles - but never breached.  After that, the bears were simply exhausted and it was up, up and away!  The pivot held and we closed higher.  QED.

The technicals

The Dow: With two impressive green candles in a row, today's gains brought us very close to resistance at 12,950 and then the upper BB at 12,991.  The indicators are also all very close to overbought levels now.  This isn't a reversal sign yet, but we need to see if the Dow can break 12,950 on Thursday.

The VIX:  Last night I wrote "this chart might still have a bit more downside left to it" and I guess it did, dropping another 1.94% and coming very close intraday to the lower BB.  Today's close now leaves us just three quarters of a point from the BB and the stochastic should be making its bullish crossover on Thursday, so I'd say there's now very little downside left here.  If the VIX does manage to go lower on Thursday, look for it to bounce Friday.

Market index futures: All three futures are in the green at 1:12 AM EDT with ES up 0.29%.  Its latest two green candles keep it solidly inside its rising RTC but have also propelled the indicators to highly overbought levels.  This isn't a reversal indicator yet, but the stochastic is now primed to begin forming a bearish crossover, my guess by Friday or next Monday.

ES daily pivot: Tonight the pivot rises again from 1352.75 to 1363.42.  This leaves us in a similar situation to last night, although this time we've got a bit more distance from the new pivot, an encouraging sign.

Dollar index: The dollar actually gained a bit, up 0.03%, though on a red candle.  But it does seem to have found some support around 57.40, just below today's close.  Interestingly though, the euro right now is forming a classic ascending triangle at the end of its recent downtrend suggesting a continued move higher.  And it is indeed running up in the overnight.  So euro up -> dollar down -> stocks up.

Transportation: Last night's flashing yellow light was abruptly extinguished today when the trans scored a 0.55% gain on increasing volume.  Or was it?  I note that the stochastic just executed a bearish crossover today.  And today's open and close were both lower than yesterday's.

Accuracy (daily calls):

Month right  wrong  no call  conditional  batting   Dow
                                          average  points trade

April   7      9      2                    .438
May    10      7      3           2        .632
 
June    8      6      6           1        .600     632   +$330
July    7      0      4           1       1.000     581

 
     And the winner is...

Well tonight it looks like there's still a bit of gas in the tank, but we may be nearing at least a short-term top.  I note that the TLT, while down on the day today did not fall as much as I expected it would last night.  In fact, today's close was higher than yesterday's.  That's not a good sign.  I also note that on Thursday we're getting Philly Fed and some unemployment and housing numbers.  These tend to drive the market, so if they're not BTE, they could derail things.  And the technicals are sort of a mixed bag tonight, with the Dow, ES, and the dollar looking good, the VIX not indicating a reversal quite yet, but the trans pointing lower.  So I guess I'm going to go out on a limb and call Thursday higher, though I'm not expecting a really big up day.

ES Fantasy Trader

Portfolio stats: with no trade again last night the account remains at $160,625 after 51 trades (40 wins, 11 losses) starting from $100,000 on 1/1/12.

Tonight, the Night Owl is going to be a Night Chicken and refrain from going long.  One piece of insurance I like to have when I put on a trade is the knowledge or at least the expectation that if the trade doesn't work out the first day, at least the trend favors turning a profit the next day or two.  Right now, my guess is that while there's a good chance of making a small profit on Thursday, if I'm wrong then there's an even better chance of going into the hole on Friday or Monday.  I don't like those kinds of odds so I'm standing aside.  With the ESFT up 60% YTD, I can afford to be choosy.  You just don't put on long trades when all the indicators are so overbought.

CUA (Commonly Used Acronyms)

BB - Bollinger Bands
DCB - Dead Cat Bounce
MA - Moving Average
RTC - Regression Trend Channel
YTD - Year To Date

Disclaimer: (My lawyer made me do it) This blog is not trading or investment advice, account management or direction.  All trades listed here are presented only as examples of the author's personal trading style.  Investing entails significant risk and trading entails even greater risks.  Deal with it.


Wednesday, July 18, 2012

Wednesday lower if pivot broken

The Hoot 
Actionable ideas for the busy trader delivered daily right up front
  • Wednesday lower if break under ES pivot, else higher - low confidence
  • ES pivot 1352.75.  Breaking below is bearish...
  • Rest of week bias higher technically.
  • Monthly outlook: bias down.
  • ES Fantasy Trader standing aside.
Recap

It wasn't looking good for my call for a higher close today early on, but my Bernanke Call paid off in the end, with the Dow canceling yesterday's losses and then some to finish with a decent 78 point gain.  And yet we've got a market that can't amke up its mind - the last four sessions have been down, up, down and up.  Does this means tomorrow will be down?  Let the charting begin...

The technicals (daily)

The Dow: It was up.  Then it was down.  Then it was up again and Mr. Market finally made up his mind and we held onto enough gains to finish 0.62% higher on Tuesday.  It still doesn't constitute a trend (recall that I require three consecutive days of directional movement to set the Swing Trade arrow) but it alleviates the concern that yesterday's indeterminate red candle signaled a larger reversal of Friday's big gains.  Anyway, today's action leaves us in not a bad spot - rising volume inside a rising RTC and indicators that continue to rise smoothly on their trip from oversold to overbought.  The only note of caution here is that we've got some resistance around 12,850, just 45 points away, that will need to be crossed to move higher.  But that doesn't seem insurmountable from here.

The VIX:  Yesterday I was thinking (for some unknown reason) that the VIX might go higher today.  It did not, losing another 3.68% on a spinning top as it continues to gravitate closer to its lower BB, now less than a point away.  The stochastic is also nearing oversold and the level from which reversals are formed.  So I'd say this chart might still have a bit more downside left to it, but the flashing yellow caution light has now turned on and we may be in for a higher VIX before the end of the week, and therefore lower stocks.

Market index futures: Tonight all three futures are down at 1:24 AM EDT with ES off by 0.33%.  We have an interesting pattern playing out here.  Last Friday and Monday gave us a big up day followed by some consolidation at the top.  Today gave us another decent up day.  And the new developing candle looks just like Monday's consolidation day (recall that Monday the market moved lower).  We're getting a flashing yellow light here in the indicators too with RSI now turning lower before even reaching overbought and the stochastic now within a few days of forming a bearish crossover.  This, ahem, bears watching.

ES daily pivot: Tonight the pivot rises from 1347.67 to 1352.75.  Unfortunately, the combination of a rising pivot and a sliding ES leaves us now just one point above the new number.  This puts us on pivot watch.  We want to see if we bounce off or break through.

Dollar index: After yesterday's big drop, today we got a gravestone doji out of the dollar on a small 0.06% loss.  The dollar remains in a four day descending RTC but we are now much closer to oversold than overbought on the indicators.  While the doji is a reversal warning that requires confirmation, I see at least the beginning of a flashing yellow warning light on this chart.  Tomorrow should tell the tale.

Transportation: I have alert reader Daniel to thank for turning me on to the importance of following the transportation index and today we got an interesting divergence here.  While the Dow was up 0.62%, the trans lost 0.74% on a red hammer that briefly tagged the 200 day MA.  Now the last time this happened was only three days ago, but back then we were at the bottom of being oversold.  Now we're out of that region and today's loss was enough to put a dent in the upward progress of the indicators.  Also, note that today's volume was considerably higher than yesterday's.  From a Dow Theory perspective, this chart is at least flashing a yellow warning light.

Accuracy (daily calls):

Month right  wrong  no call  conditional  batting   Dow
                                          average  points trade

April   7      9      2                    .438
May    10      7      3           2        .632
 
June    8      6      6           1        .600     632   +$330

July    7      0      4           0       1.000     581

     And the winner is...

TLT, daily
With so many yellow caution lights blinking suddenly, it's time to pull out my secret weapon - the TLT.  This one is worth a chart tonight.  Check this out.  Notice the rising RTC beginning on 7/5.  People loving them yummy bonds, just scarfing 'em up.  Then yesterday, uh oh, them bonds don't feel so good.  We close outside the RTC - bearish setup.  And then today, urrrrp, down 0.79%, bearish trigger.  I will note that the last big TLT top, on 6/1 marked the start of a three-week rally in the market.  And the recent TLT action is looking pretty clearly like a top to me.  Just sayin...

Oh yes, so who's the winner?  Hard to say.  The overnight ES position is deteriorating as I write, the trans are looking decidedly weak, and the charts are all looking like they're starting to run low on gas.  Except for the TLT, which is signaling full speed ahead.

I wish I could make it simple, but tonight I'm going to have to make it a conditional call.  If ES breaks under its pivot of 1352.75 by let's say mid-morning, then we're closing lower Wednesday.  If it bounces off, look for a higher close.  Right now, my bias is to the downside, as ES just continues moving lower as I hit the Publish button.

ES Fantasy Trader

My decision to stand aside last night was basically not too bad.  ES finally did move a bit higher from where it was when I wrote my post, but there wasn't all that much money to be made.  It seems to be more a day trader's market the past few days.

Portfolio stats: with no trade again last night the account remains at $160,625 after 51 trades (40 wins, 11 losses) starting from $100,000 on 1/1/12.With a conditional call tonight, once again I can't really put on an informed trade, so we'll just stand aside once again.

CUA (Commonly Used Acronyms)

BB - Bollinger Bands
DCB - Dead Cat Bounce
MA - Moving Average
RTC - Regression Trend Channel
YTD - Year To Date

Disclaimer: (My lawyer made me do it) This blog is not trading or investment advice, account management or direction.  All trades listed here are presented only as examples of the author's personal trading style.  Investing entails significant risk and trading entails even greater risks.  Deal with it.

 

Tuesday, July 17, 2012

Tuesday higher

The Hoot 
Actionable ideas for the busy trader delivered daily right up front
  • Tuesday higher, low confidence
  • ES pivot 1347.67.  Holding above is bullish..
  • Rest of week bias higher technically.
  • Monthly outlook: bias down.
  • ES Fantasy Trader standing aside.
Recap

Much was made about the Dow's 50 point decline in the news today with headlines like "Dow now down 7 of last 8".  But the charts tell a different story, one we will recount below.

The technicals (daily charts)

The Dow: Yes, the Dow was down today, and while it wasn't quite a doji as I thought, it also didn't give back all of Friday's big gains.  Basically, the pattern this year of small retracements after big gains continued to hold.  Today's candle was fairly indeterminate, not quite spinning top, not quite hanging man, not quite dark cloud cover.  I can't really get too excited about it.  I think the indicators are more telling and they're still on their march upward from oversold, so that's a positive sign.

The VIX:  Today the VIX put in an unusual inside hammer.  Although this was a red candle, the VIX gained 2.21% on the day.  And the low of the day was actually higher than yesterday, showing the reluctance of the VIX to pay a visit to the lower BB.  Indeed, it now seems to have some decent support at 16.50.  With the futures now oversold, I'd say the VIX has a chance of putting in a green candle on Tuesday.

Market index futures: All three futures are up significantly at 1:30 AM EDT with ES gaining 0.45%.  Today's small red candle at the top of Friday's big gain was typical of the pin action we've been seeing after these kinds of moves lately.  What's encouraging is the turn around in the overnight giving us a bullish engulfing pattern in the new developing daily candle.  I understand it's risky to read candles that aren't fully cooked, but at the moment, it's all I've got to go on.  In any case, the indicators are all quite bullish now, well on their way from oversold to overbought.  The stochastic bullish crossover that occurred last Thursday completed nicely and proceeds apace.  ES has also now cleared a minor resistance level at 1351, so overall, I'm liking this chart.

ES daily pivot: Tonight the pivot rises from 1344.58 to 1347.67.  Even at that, with the spike in ES at 9:15 this evening, we're even further above the pivot than before - a good sign.

Dollar index: The dollar decoupled from the market once again, making me question this metric, once again.  In fact, today's 0.31% was larger than Friday's, yet the market was down anyway.  For what it's worth, the dollar seems to have more downside left in it.  Whether this translates to higher stocks on Tuesday is now open to question.

Transportation: The trans were down today too, but with a loss double that of the Dow.  This was enough to send RSI off its upward course, though the stochastic still looks in good shape.  This pattern reminds me of something we saw in April, where a big gain was followed by a small loss.  The next day (4/16) was a green candle that was lower than the day before.

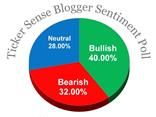
Sentiment: Once again it's time for the latest weekly TickerSense Blogger Sentiment Poll.  We continue to track the poll to see how well it performs.  Here's the updated cumulative list for this year:


Wk.# Week   % Bullish  % Bearish  NightOwl SPX  Accuracy

  1  1/3        46         21        +     1258   1/1
  2  1/9        56         37        +     1278   2/2
  3  1/17       41         33        +     1289   3/3
  4  1/23       46         32        +     1315   4/4
  5  1/30       48         31        +     1316   5/5
  6  2/6        56         30        +     1345   6/6
  7  2/13       48         31        +     1343   7/7
  8  2/21       44         32        +     1361   8/8
  9  2/27       48         24        +     1366   9/9
 10  3/5        43         26        +     1370  10/10
 11  3/12       46         32        +     1371  11/11
 12  3/19       46         29        +     1404  11/12
 13  3/26       39         29        +     1397  11/13
 14  4/2        42         21        +     1408  11/14
 15  4/9        25         46        -     1398  12/15
 16  4/16       26         48        -     1370  13/16
 17  4/23       30         48        -     1379  14/17
 18  4/30       44         32        +     1403  14/18
 19  5/7        23         50        -     1350  15/19
 20  5/14       32         44        -     1353  16/20
 21  5/21       30         52        -     1295  16/21
 22  5/29       35         42        -     1318  16/22
 23  6/4        32         48        -     1278  16/23
 24  6/11       28         40        -     1326  16/24
 25  6/18       39         26        -     1343  16/25
 26  6/25       38         46        -     1335
 27  7/2        41         40        -     1362
 28  7/9        42         38        -     1355
 29  7/16       44         32        -     1357

Again, the SPX number is the closing price of the S&P on the Friday before each new poll comes out.  The "NightOwl" column is how I voted.  Since the poll is for 30 days out, after the first four weeks we're able to see how well we did.  This week we see that my bearish call on 6/11 was wrong (again), the S&P now being higher than then.  I'm using the column "Accuracy" to track my calls.  So now I'm 16 for 25 .  After an impressive start this year, my monthly calls have now been wrong for six weeks running.  Meanwhile the poll's accuracy rises a bit to 68% YTD.  For the record, I voted bearish once again.

This week the poll was characterized by a slight increase in bullish sentiment coupled with a larger drop in bearish sentiment.  While the bull-bear gap widened for the third week in a row, both numbers are still not at YTD extremes, so I'm not sure we can draw any conclusions from this.  I'll admit I'm a bit surprised at the way bullish sentiment has been increasing (and bearish decreasing) for the last four weeks though.  Note too that bullish sentiment is actually two points higher now than it was on April 2nd, just before a very ugly week.  Just something to keep in mind.

Accuracy (daily calls):

Month right  wrong  no call  conditional  batting   Dow
                                          average  points trade

April   7      9      2                    .438
May    10      7      3           2        .632
 
June    8      6      6           1        .600     632   +$330

July    6      0      4           0       1.000     503


     And the winner is...

Given that today played out as expected and that the markets did not give back major portions of Friday's gains, I'm encouraged that the underlying strength in the charts may come to the fore on Tuesday particularly in view of the rumors surrounding what The Bernank may have to say about the economy (how do people know this?).  I know that the trans are looking a bit weak and the VIX is rather indeterminate but we've got some decent gains in the futures in the overnight so I'm going to go ahead and call for a higher close Tuesday.

ES Fantasy Trader

Portfolio stats: with no trade last night the account remains at $160,625 after 51 trades (40 wins, 11 losses) starting from $100,000 on 1/1/12. Tonight, although ES is up I'm afraid we got to the bus stop just in time to see its tail lights receding in the distance.  ES took a sudden spike earlier this evening while I was doing Other Stuff and I'm concerned that that may have been it.  There are nights where the market runs higher the next day but all the gains in ES have already happened.  So reluctantly, even though I believe we're going higher Tuesday, I must stand aside and forgo the nightly ES trade once again.  At least we know that there'll always be another bus coming around soon.   Reminder: I post these trades live on Twitter @nightowltrader.

CUA (Commonly Used Acronyms)

BB - Bollinger Bands
DCB - Dead Cat Bounce
MA - Moving Average
RTC - Regression Trend Channel
YTD - Year To Date

Disclaimer: (My lawyer made me do it) This blog is not trading or investment advice, account management or direction.  All trades listed here are presented only as examples of the author's personal trading style.  Investing entails significant risk and trading entails even greater risks.  Deal with it.


Monday, July 16, 2012

Monday uncertain

The Hoot 
Actionable ideas for the busy trader delivered daily right up front
  • Monday uncertain, bias slightly lower
  • ES pivot 1344.58.  Holding above is bullish..
  • Rest of week bias higher technically.
  • Monthly outlook: bias down.
  • ES Fantasy Trader standing aside.
Recap

Well I thought we'd see higher on Friday but I was surprised at the moxie of the move as the Dow motored ahead 204 points.  This leaves us in an interesting situation, with six straight down days snapped by a big up move.  Was this a one-off or is there more to come?  The answer, my friend, is blowing in the charts...

The technicals

The Dow: Friday's close at 12,(lucky)777 demonstrated, once again, the power of the regression trend channel.  Wednesday we closed just outside the descending RTC - that's the bullish set-up.  Thursday we moved lower still but traded entirely outside the RTC - that's the bullish trigger.  And ka-ching, Friday was the pay-off.  This pop also retraced 50% of the previous downturn to leave us at an interesting juncture.  Volume was hardly convincing, but the indicators have now all clearly bottomed at oversold and the stochastic finally finished the bullish crossover I was talking about last week.  This chart is now looking healthy.

The VIX:  Thursday night I wrote that the VIX "may be signaling a decline on Friday".  I guess it was, since the VIX dropped 8.67% on Friday on a solid red candle.  The close at 16.74 was right at support but the indicators and the futures are both pointing lower.  How much lower?  Well the VIX often likes to touch its lower BB before reversing and that's at 15.79 right now, so maybe another point down.

Market index futures: Tonight, perhaps not unexpectedly, all three futures are back in the red, with ES down 0.2% at 1:24 AM EDT.  Friday's tall green candle popped us right out of the descending RTC for a solid bullish setup.  We'd need to close below 1331 Monday to cancel this setup.  With the bullish stochastic crossover just newly completed and indicators now back on the rise from oversold, more upside here is a distinct possibility.

ES daily pivot: Tonight the pivots jumps from 1329.50 to 1344.58.  Even with ES drifting a bit lower in the overnight, this still leaves us above the new number, though by a lot less than before.  Still, that's bullish unless we break under the pivot.

Dollar index: After giving us a star on Thursday, the dollar dropped 0.4% Friday to close outside its rising RTC for a bearish setup.  With indicators having just peaked and only now starting to come back off very overbought levels, the dollar could very well move lower again on Monday, which would be good for stocks.  Also, the bearish stochastic crossover is now complete.

Also note that Friday's trade in the euro showed that it has indeed found some support at the 1.22 level and exited its own descending RTC for a bullish setup.  Euro higher -> dollar lower -> stocks higher.

Transportation: The daily trans on Friday  were pretty much an analogue to the Dow.  Same big pop, same RTC exit, same bullish stochastic crossover.  Looking good.

Accuracy (daily calls):

Month right  wrong  no call  conditional  batting   Dow
                                          average  points trade

April   7      9      2                    .438
May    10      7      3           2        .632
 
June    8      6      6           1        .600     632   +$330

July    6      0      3           0       1.000     503

     And the winner is...

While the charts tonight are generally fairly positive, it's good to remember that we're coming off a big gain on Friday.  And as I pointed out after our last big gain on 6/29, the pattern commonly is for big up days to be followed by dojis or small declines, so that's what I'm expecting Monday.  Although my bias is slightly negative, it's not solid enough to warrant a call in that direction.  Therefore I will simply call Monday uncertain.

Note also that Uncle Ben will be talking again on Tuesday and Wednesday and that always throws some uncertainty into the markets.  Should make for another interesting week.

ES Fantasy Trader

 Last Thursday night I put on a long trade that had me nervous.  It was looking like we were due for a bounce but I didn't really have the confirmation on any of the charts that a prudent investor should have.  So I just went for it - and was rewarded with a tidy 14.5 point gain on lucky Friday the 13th.

Portfolio stats: the account now rises to $160,625 after 51 trades (40 wins, 11 losses) starting from $100,000 on 1/1/12. With the lack of a good edge, tonight we simply stand aside..   Reminder: I post these trades live on Twitter @nightowltrader.

SLD    10    ES    false    SEP12 Futures     1347.50    USD    GLOBEX    JUL 13 11:51:30  
BOT    10    ES    false    SEP12 Futures     1333.00    USD    GLOBEX    JUL 13 02:02:52  

CUA (Commonly Used Acronyms)

BB - Bollinger Bands
DCB - Dead Cat Bounce
MA - Moving Average
RTC - Regression Trend Channel
YTD - Year To Date

Disclaimer: (My lawyer made me do it) This blog is not trading or investment advice, account management or direction.  All trades listed here are presented only as examples of the author's personal trading style.  Investing entails significant risk and trading entails even greater risks.  Deal with it.