Friday, June 14, 2013

Friday uncertain

The Hoot 
Actionable ideas for the busy trader delivered daily right up front
  • Friday uncertain.
  • ES pivot 1624.58.  Holding above is bullish.
  • Next week bias uncertain technically.
  • Monthly outlook: bias higher.
  • ES Fantasy Trader remains short at 1600.25.
Recap

June is starting off very badly for the Night Owl, prediction-wise, as I'm now on my worst accuracy streak since I started keeping score over a year ago.  Maybe it's the volatility or the Florida heat, but we're definitely hitting a dead spot here.  And speaking of Florida, the Night Owl is flying back north (and not on Southwest, the Airline of the Damned) next Monday.  That means I'll be taking Sunday and Monday night off, so the next publication won't be until next Tuesday night.  Meanwhile, let's see if we can figure out anything at all from these tricky charts.

The technicals (daily)

The Dow: The Dow staged a big comeback on Thursday, due in part if one is to believe it, a WSJ article about how the Fed is going to stand pat next week.  Well that or not, it effectively stopped what was looking like a developing rout in its tracks and popped us right back out of the descending RTC for a bullish setup, our second in four days.  It also pulled the plug on last night's bearish stochastic crossover and put the Dow back above its pivot with a bullish engulfing pattern.  So just as the sun comes out after a hurricane, this chart is now looking fairly positive compared to last night.

The VIXAs fast as the VIX popped  on Wednesday, that;s how fast the balloon burst on Thursday, completely giving up all those gains and a bit more to close back at 16.41.  I'd been looking for a lower VIX but honestly didn't expect it before Friday.  But now with a bearish harami in VVIX and the VIX falling out of its rising RTC for a bearish setup, it could move lower again on Friday.  I'm certainly not expecting it to jump back to 18+ again.

Market index futures: Tonight the futures are mixed at 1:r45 AM EDT with ES down by 0.06%, YM down 0.05% but NQ up 0.7%.  With such small overnight moves, this isn't much of a surprise.  After tow bad days dragged ES back into its descending RTC, on Thursday one mighty blast pushed it right back out again for another bullish setup.  And like the Dow, this chart is looking much healthier tonight than last.

ES daily pivot: Tonight the pivot rises from 1619.25  to 1624.58.  We remain floating above the new number, so that's bullish.

Dollar index: The dollar remained locked in a straight descending RTC on Thursday, down another quarter percent as it sank further below its 200 day MA.  At least I was right when I wrote last night, "still no sign of a reversal".  And recall that I mentioned 55.38 as support.  Well lookee where the dollar closed on the $USDUPX: 55.3828.  And we closed there on a doji, so for the first time in days, there's at least a possibility of a move higher on Friday, but with so much downward momentum, we have to have confirmation.  Though speaking of momentum, that has actually begun rising, three days ago in fact.  So now I'd say there's at least a chance of a higher close on Friday.

Euro: The euro has now put in two consecutive spindly spinning tops warning of a reversal although it remains stuck in its rising RTC.  However, the overnight is forming as a dark cloud cover.  Unless the euro can close above 1.3376 on Friday, this chart will be looking bearish for Monday.  It is starting to look toppy.

Transportation: Pretty much the same story as the Dow here.  The trans posted a big 1.90% gain, stopping only on resistance at 6346.  With the indicators sort of wandering around now, we'll need to see if the trans can crack this level on Friday.  There seems to be some gas back in the tank, but the way things have been going lately, who knows.

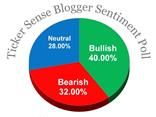
Sentiment: Once again it's time for the latest weekly TickerSense Blogger Sentiment Poll.  We continue to track the poll to see how well it performs.

Wk.# Week   % Bullish  % Bearish  NightOwl Poll SPX  Accuracy Poll

  1  12/31      40         48        -      -   1402   0/1
  2  1/7        47         30        +      +   1466   1/2
  3  1/14       52         15        +      +   1472   2/3
  4  1/22       50         21        +      +   1486   3/4
  5  1/28       44         26        +      +   1503   4/5
  6  2/5        40         36        +      +   1513   5/6
  7  2/11       43         25        +      +   1518   6/7
  8  2/19       21         43        -      -   1520   6/8
  9  2/25       30         52        -      -   1516   6/9
 10  3/4        29         39        -      -   1518   6/10
 11  3/11       41         26        +      +   1551   7/11
 13/18       41         37        +      +   1561   8/12
 13  3/25       31         38        +      -   1557   8/13
 14  4/1        38         38        +      x   1569   9/14
 15  4/8        32         50        -      -   1553   9/15
 16  4/15       33         50        +      -   1589   10/16   9/16
 17  4/22       19         63        -      -   1555   10/17   9/17
 18  4/29       33         58        -      -   1582   10/18   9/18
 19  5/6        50         31        +      +   1614   11/19  10/19
 20  5/13       37         37        +      x   1634   12/20  10/19
 21  5/20       50         25        +      +   1667 
 22  5/28       ??         ??        +      ?   1650 (poll data missing)
 23  6/3        29         38        -      -   1631
 24  6/10       38         38        +      x   1643

Again, the SPX number is the closing price of the S&P on the Friday before each new poll comes out.  The "NightOwl" column is how I voted.  The "Poll" column is how the majority of participants voted.  Since the poll is for 30 days out, after the first four weeks we're able to see how well we did.  This week we see that I voted bullish four weeks ago, so that was right.   However, the poll as a whole was exactly tied, so there is no right or wrong and we therefore skip this week.  Therefore we  continue the year with an accuracy of 12  for 20, or 60%.   The poll as a whole remains 10  for 19 or 53%.

This week, we see that for the third time this year we have an exact tie - 37.5%.  No doubt this reflects the recent increase in volatility which is churning the market as it sends the charts every which way.   And along those lines, after one week bearish, I've now switched my own vote back to bullish.


Accuracy (daily calls): 

Month     right wrong  no call  conditional  batting   Dow
                                             average  points

January    5      7      6           3        0.533   -101
February   3      4      5           6        0.692    131
March      5      7      5           2        0.500    121 

April      7      5      5           3        0.667    328

May        3      4      6           4        0.636     85

June       1      5      2           0        0.167   -256


     And the winner is...

I've been so wrong lately I'm getting afraid to make any predictions at all.  What I'm expecting now is a typical pause after a big move up, perhaps a doji day, so that simply translates into a call for Friday uncertain.

ES Fantasy Trader


Portfolio stats: the account remains at $110,375 after 12 trades (10 for 12 total, 5 for 5 longs, 5 for 7 short) starting from $100,000 on 1/1/13.  Tonight we remain short at 1600.25.  This trade started off well enough but went horribly wrong while I was asleep.  By the time I woke up the next morning, the damage was done.  So we'll take a bit of heat and see if the yo-yo will yo back in our favor anytime soon.

Thursday, June 13, 2013

Thursday lower

The Hoot 
Actionable ideas for the busy trader delivered daily right up front
  • Thursday lower, medium confidence.
  • ES pivot 1619.25.  Holding below is bearish.
  • Rest of week bias lower technically.
  • Monthly outlook: bias higher.
  • ES Fantasy Trader going short at 1600.25.
Recap

Sigh - I called Wednesday higher, and indeed it was - for about 60 seconds.  Then it was all downhill from there as the Dow closed just above the lows of the day at 14,995 for an ugly 127 point loss.  I'm getting the impression that the gestalt of the market is changing but we need to consult the charts to quantity that just a bit.  So let us dive in  and test the waters.

The technicals (daily)

The Dow: Well there you have it - we've now snapped the two day losing streak for the Dow(n).  Wednesday's dump brought us back into the descending RTC and formed a fresh bearish stochastic crossover.  Nothing but pure ugly on this chart.

The VIXOnce again the VIX confounded me by posting an impressive 8.9% gain on Wednesday that canceled Tuesday's doji and confirmed a bullish stochastic crossover.  Actually, looking at the recent action of the VIX, it's looking pretty jittery.  This made me take a look at the VIX of the VIX and lo and behold, it has absolutely spiked in the past two days with a bullish stochastic crossover of its own.  But it's also now near resistance levels from which it has moved lower in the past, so I'm thinking that while we could still have a few more days of upside action here, things will settle down before too long, maybe like next Monday.  A drop in $VVIX will lead to a lower VIX which will improve the market.

Market index futures: Tonight all three futures are significantly lower at 1:46 AM EDT with ES down by 0.57%.  We're back in the descending RTC, the indicators continue to fall but are still nowhere near oversold, and the developing candle is giving us a very bearish-looking three black crows pattern.  This chart is just looking quite weak tonight.

ES daily pivot: Tonight the pivot falls from 1630.33  to 1619.25. ES was below all day and remains below despite this large drop, so that's definitely a bearish sign.

Dollar index: At least I got something right.  Last night I wrote "There's nothing bullish about this chart" and after breaking below its 200 day MA, the dollar sank even more on Wednesday, down another 0.20%.  The indicators are all oversold-broken now and have lost their predictive power.  So nothing has changed here and still no sign of a reversal.  With the 200 MA and support at 55.79 ($USDUPX) gone, there's no more support until 55.38.

Euro: And of course the euro continues to march higher, locked solidly in a rising RTC with a green spinning top on Wednesday.  But that doji has already been canceled as the euro is already up another 0.21% in the overnight alone.  There's weak resistance at 1.3391, then 1.3455.  But for now, no sign of a lower euro.

Transportation: Same story as the Dow here - confirmed doji, two down candles, bearish stochastic crossover, bleah.


Accuracy (daily calls):

Month     right wrong  no call  conditional  batting   Dow
                                             average  points

January    5      7      6           3        0.533   -101
February   3      4      5           6        0.692    131
March      5      7      5           2        0.500    121 

April      7      5      5           3        0.667    328

May        3      4      6           4        0.636     85

June       1      4      2           0        0.200    -75


     And the winner is...

Much as I'd like to see a turn-around, everything I'm looking at tonight is bearish.  Also, the Asian markets are getting pounded, with the Nikkei down 6% as I write.  I don't usually mention these, but a drop that big kind of gets your attention.  So I think the only logical call here is for Thursday lower.  I'll be happy to be proven wrong.

ES Fantasy Trader

Portfolio stats: the account remains at $110,375 after 12 trades (10 for 12 total, 5 for 5 longs, 5 for 7 short) starting from $100,000 on 1/1/13.  Tonight we go short at 1600.25.  I'm afraid we've missed the majority of this move, but I think there's still a few scraps left to pick up on the short side.

Wednesday, June 12, 2013

Wednesday higher

The Hoot 
Actionable ideas for the busy trader delivered daily right up front
  • Wednesday higher, low confidence.
  • ES pivot 1630.33.  Holding above is bullish.
  • Rest of the week bias higher technically.
  • Monthly outlook: bias higher.
  • ES Fantasy Trader standing aside.
Recap

Well it looks like the volatility is back, Jack, as the Dow dumped 117 points on Tuesday, a result I was not at all anticipating and which brought us back to where we were two days ago.  So with three up days effectively canceled out, where do we go next?  Once again, the only place to turn is the charts.

The technicals (daily)

The Dow: Tuesday's red candle confirmed Monday's doji and very nearly closed back into the descending RTC, which would cancel the bullish breakout.  Meanwhile, the indicators remain mixed at about halfway between oversold and overbought.  RSI and the stochastic are rising, momentum and money flow are falling, and OBV remains quite high (over 1B).  It sounds naive but we note, as many others have, that the Dow has still not had more than two consecutive down days all year so far (and we're almost halfway gone already).  That alone seems to favor a move higher on Wednesday.  I'll note too that Tuesday's close, 15,122 was right on a three week support line.

The VIXTuesday's's big 10.56% gap-up in the VIX canceled the bearish RTC trigger, but did so with a tall skinny hanging man.  However, it also set up the stochastic for a bullish crossover, so this chart is really playing it close to the vest tonight.  There is one good tell here though: the VIX is now very extended from its pivot of 15.38 so I'd be looking for some sort of gap-filling reversion on Wednesday.

Market index futures: Tonight all three futures are higher at 1:25 AM EDT with ES up by 0.23%.  This non-trivial gain coming on the heels of Tuesday's big drop makes me think that the usual pattern so far this year is intact - with big one day drops followed by retracements of 25 to 75%.  We do have a stochastic that's trying to form a bearish crossover, but any further advances in ES will rapidly unwind that.

ES daily pivot: Tonight the pivot drops from 1641.;66  to 1630.33.  After spending the day underwater, ES began a slow drift higher around 6 PM Tuesday in a move that broke through the new pivot around 12:30 AM -  definitely a bullish sign.

Dollar index: It was a big day for the dollar on Tuesday as it broke through its 200 day MA ($USDUPX, the first time that's happened since last November 19th. That move presaged a month of lower prices.  And right now the $ remains stuck in a steep descending RTC from May 22nd so the current trend remains intact.  There's nothing bullish about this chart.

Euro: And correspondingly, the euro remains in a rising RTC, posting a second day of solid gains on Tuesday.  Last night I wrote "This keeps us inside a rising RTC so despite highly overbought indicators, I can't say I see a move lower here now" and nothing has changed tonight.  That syncs with my bearish view of the dollar.


Transportation: On Tuesday the trans confirmed Monday's bearish spinning top with a one percent decline that also canceled the bullish RTC setup - no trigger here.  In fact, we're right back into the descending RTC.  So this chart is not looking particularly bullish tonight.


Accuracy (daily calls):

Month     right wrong  no call  conditional  batting   Dow
                                             average  points

January    5      7      6           3        0.533   -101
February   3      4      5           6        0.692    131
March      5      7      5           2        0.500    121 

April      7      5      5           3        0.667    328

May        3      4      6           4        0.636     85

June       1      3      3           0        0.250     52


     And the winner is...

Tuesday and Wednesday are historically the weakest days of this week but we do have this ongoing pattern of buyers stepping in after two consecutive down days all year so far.  With the TLT remaining in a major downtrend and copper right at a two-month support line, I'm not so sure about more downside being available here.  I also don't like the look of that hanging man on the VIX.  I also looked at the SPX Hi-Lo index.  It just touched its 200 day MA on Tuesday, an event that has happened three times before this year.  In all three cases, the market moved higher the next day.

So call me crazy, but I'm going to go waaay out on a limb and go with Wednesday higher.

ES Fantasy Trader

Portfolio stats: the account remains at $110,375 after 12 trades (10 for 12 total, 5 for 5 longs, 5 for 7 short) starting from $100,000 on 1/1/13.  Tonight we stand aside because I don't trade on calls that start off "call me crazy".

Tuesday, June 11, 2013

Tuesday uncertain

The Hoot 
Actionable ideas for the busy trader delivered daily right up front
  • Tuesday uncertain.
  • ES pivot 1641.66.  Holding below is bearish.
  • Rest of the week bias higher technically.
  • Monthly outlook: bias higher.
  • ES Fantasy Trader standing aside.
Recap

I was expecting a small gain for Monday and that's what we got - for about the first tow hours.  Then we moved a bit lower and the Dow closed down all of 9.5 points.  That's what I get for not calling "uncertain": when I'm expecting a small move.  But not matter, this result is still interesting and we now investigate what it means for Tuesday.  Read on...

The technicals (daily)

The Dow: On Monday the Dow gave us a doji sitting on top of last Friday's big run up.  While this signals a possible reversal, these haven't been doing too well this year and we're still a long way from overbought on the indicators.  So this is just a flashing yellow light at this point.

The VIXThe VIX surprised me on Monday by not following through on its previous two days of losses, gaining instead 1.98% as its 200 day MA provided some support.  But the indicators continue to fall off overbought and we do now have a bearish RTC trigger so I think any upside moves will be limited.

Market index futures: Tonight all three futures are lower at 1:42 AM EDT with ES down by 0.14%.  Monday's candle was a bearish inverted hammer.  But it came outside the descending RTC and that's a bullish setup.  Also, the indicators are only about halfway from oversold to overbought, so this chart is pretty murky tonight.

ES daily pivot: Tonight the pivot rises from 1633.50  to 1641.66.  This jump, combined with ES's move lower now puts us below the new pivot - a bearish sign.

Dollar index: The dollar put in early gains on Monday only to give them back as they day wore on, leaving behind a red candle sitting above Friday's green for a dark cloud cover.  But - the indicators remain oversold so it's not clear how this will play out..

Euro: I missed this one - rather than going lower, the euro put in a strong bullish engulfing candle on Monday and we're getting some positive pin action in the overnight.  This keeps us inside a rising RTC so despite highly overbought indicators, I can't say I see a move lower here now.

Transportation: The trans on Monday gave us a small red spinning top pretty much as expected.  But it was enough to put a damper on the indicators which actually turned lower before even reaching overbought.  But with a bullish RTC setup the picture on this chart is decidedly mixed.  I'm going to wait & see on this one.


Accuracy (daily calls): 

Month     right wrong  no call  conditional  batting   Dow
                                             average  points

January    5      7      6           3        0.533   -101
February   3      4      5           6        0.692    131
March      5      7      5           2        0.500    121 

April      7      5      5           3        0.667    328

May        3      4      6           4        0.636     85

June       1      3      2           0        0.250     52


     And the winner is...

This is one of those nights where we're seeing a combination of reversal (lower) warnings that require confirmation along with internal conflicts in the charts, at least according to my system of analysis.  Bottom line - there's no real clear-cut direction right now.  So, much as I hate to wimp out because I still see something of a positive bias, the only choice I have in this situation is to call Tuesday uncertain.

ES Fantasy Trader

Portfolio stats: the account remains at $110,375 after 12 trades (10 for 12 total, 5 for 5 longs, 5 for 7 short) starting from $100,000 on 1/1/13.  Tonight we stand aside with the "uncertain" call.

Monday, June 10, 2013

Monday higher

The Hoot 
  • Monday higher, low confidence.
  • ES pivot 1633.50.  Holding above is bullish.
  • Rest of the week bias higher technically.
  • Monthly outlook: bias higher.
  • ES Fantasy Trader standing aside.
Recap

Well I was uncertain about Friday but it turns out that the jobs numbers were BTE and that was enough to propel the Dow to a 208 point  advance, its biggest daily gain since last December.  So now what?  Let's check the charts for Monday's direction.

The technicals (daily)

The Dow: Friday's big green marubozu confirmed Thursday's hammer and bounced the Dow right out of its descending RTC for a bullish setup.  It also formed a weekly bullish hammer and sent the indicators rising off of oversold.  There's really nothing negative I can see on this chart for Monday.

The VIXLast Thursday night I wrote "this chart looks ready for more downside on Friday" and so it was, dropping nearly 9% to close just above its 200 day MA support  in a move that dropped it out of a strong rising RTC for a bearish setup and also clearly completed a bearish stochastic crossover.  I would not be surprised to see the VIX fall back through its 200 MA on Monday.

Market index futures: Tonight all three futures are higher at 1:42 AM EDT with ES up by 0.11%.  After Friday's big move up, this is enough to get us out of the descending RTC for a bullish setup.  The bullish stochastic crossover is also complete now and the indicators are rising so this chart is looking in pretty good shape for Monday.

ES daily pivot: Tonight the pivot jumps from 1614.50  to 1633.50.   Impressively enough, even with that gain we remain above the new pivot by a good seven points, so this one remains bullish.

Dollar index: Last Thursday I was expecting a reversal for the dollar but wasn't sure it would come on Friday.  Well it did, as the 200 day MA provided solid support.  The dollar chart now has the look of an exponential run-down and those always end in reversals, often quite dramatic.  With Friday's spinning top and support at the 200 MA, I'd expect more upside here on Monday.

Euro: Meanwhile the euro provided us with a spinning top of its own warning of a reversal.  That seems to be getting confirmed in the Sunday overnight, already down 0.20%.  That's enough to cause the indicators to start falling from their highly overbought levels, so I think the euro is going lower still on Monday.  And that syncs with my call for a higher dollar.

Transportation:Once again the trans outperformed the Dow with a big 2.37% pop that confirmed what I wrote on Thursday night, "the technicals favor more upside here on Friday."  That move was just enough to pull us out of the descending RTC for a bullish setup and clearly complete a bullish stochastic crossover as the indicators are now well on their way from oversold to overbought.   So I'd be looking for more upside here, though with such a big gain Friday, the trans may shift into neutral for a day before resuming their advance.


Accuracy (daily calls): 

Month     right wrong  no call  conditional  batting   Dow
                                             average  points

January    5      7      6           3        0.533   -101
February   3      4      5           6        0.692    131
March      5      7      5           2        0.500    121 

April      7      5      5           3        0.667    328

May        3      4      6           4        0.636     85

June       1      2      2           0        0.333     62


     And the winner is...

With no major economic news coming out on Monday and two big days of gains behind us, I see nothing bearish in the charts tonight.  But I also think the market may need a day to regroup so while I am going to call Monday higher, I also think the gains will be limited.

ES Fantasy Trader

Portfolio stats: the account remains at $110,375 after 12 trades (10 for 12 total, 5 for 5 longs, 5 for 7 short) starting from $100,000 on 1/1/13.  Tonight we stand aside just because I'm not seeing a lot of opportunity here.