Friday, July 26, 2013

Friday higher

The Hoot 
Actionable ideas for the busy trader delivered daily right up front
  • Friday higher, low confidence.
  • ES pivot 1680.75.  Holding above is bullish.
  • Next week bias uncertain technically.
  • Monthly outlook: bias higher.
  • ES Fantasy Trader remains short at 1643.00.
Recap

And so the crab market marches on  - sideways.  Dow up a hair, SPX reversing what looked like the start of a downturn... arrgh!  Just where does Mr. Market think he's going?  Let's scour the charts for any signs of a road map.

The technicals (daily)

The Dow: On Thursday the Dow defied my predictions of a loss by gaining 13 points.  The Dow has now been putting in reversal candles for the past five sessions in a row - and all to naught.  Thursday's was a tall tall hanging man, complete with overbought indicators.  And what does this all mean?  I'll tell you what it means.  It means bupkiss.  Nil, nada, nothing, zilch, zero.  As long as the Dow continues to find support around 15,535 and encounter resistance at 15,585, we're just stuck in a channel.  And I see no sign of anything different on Friday.

The VIXAfter a promising start on Wednesday, the VIX fell back on Thursday, losing 1.59% on a dark cloud cover.  There is a related warning on VVIX in the form of a spinning top, so any further advance in the VIX on Friday is certainly now in question. 

Market index futures: Tonight all three futures are higher at 12:44 AM EDT with ES up by 0.24%.   After a big star doji on Thursday, it's beginning to look like the recent three day decline was yet another fake out breakdown.   And the overnight move higher certainly seems to be confirming that.  Add in a bullish RTC exit and a stochastic moving into position for a bullish crossover from a high level, and it all points to a higher close on Friday.

ES daily pivot: Tonight the pivot drops from 1685.42 to 1680.75.  After dancing about the old pivot all evening, ES broke decidedly above at 9:05 PM, and the drop in the new pivot puts us even higher above it, so that's all quite a bullish sign.

Dollar index: On Thursday the dollar gave up all of Wednesday's gains and then some, losing 0.42%.as it continues to careen wildly across the chart.  It tested its 200 day MA before ending right back when it closed on Tuesday.  With that support established and a bullish RTC exit, there might be some upside here on Friday, but honestly this chart is just too disjointed to get a good bearing on.

Euro: Last night I mentioned the daily pivot as key.  The euro did indeed cross it early Thursday morning and so the euro closed higher, to 1.3246.  The overnight is showing a big gap up, although that may be a misprint due to one bad bar from eSignal - not sure.  What is sure is that the euro is now up another 0.25%, impressive for this hour of the night.  Either way, that keeps us in a rising RTC.  And with the upper BB not til 1.3341 and no nearby resistance, I'd say odds favor a higher euro on Friday.

Transportation: Last night I wrote "we likely have at least some more downside here on Thursday and then we'll have to see about Friday".  Well we indeed got a move lower - and then a retracement to finish down just 0.05% on a big doji star with increased volume.  While the indicators are still not quite down to oversold, I'm now more confident that we'll see a move higher here on Friday.


Accuracy (daily calls):

Month     right wrong  no call  conditional  batting   Dow
                                             average  points

January    5      7      6           3        0.533   -101
February   3      4      5           6        0.692    131
March      5      7      5           2        0.500    121
April      7      5      5           3        0.667    328
May        3      4      6           4        0.636     85

June       6      5      6           0        0.545    543

July       9      2      2           3        0.857    483


     And the winner is...

What a difference a day makes.  All the bearish signs I saw last night have vanished into thin air.  Indeed, the charts are pretty bullish tonight.  And given that the prevailing longer term trend remains up, I will call Friday higher.

ES Fantasy Trader

Portfolio stats: the account remains at $115,000 even after 14 trades (11 for 14 total, 6 for 6 longs, 5 for 8 short) starting from $100,000 on 1/1/13.  Tonight we remain short at 1643.00.  I'm at the stage of not even wanting to look at this trade anymore.

Thursday, July 25, 2013

Thursday lower

The Hoot 
Actionable ideas for the busy trader delivered daily right up front
  • Thursday lower, low confidence.
  • ES pivot 1685.42.  Holding below is bearish.
  • Friday bias uncertain technically.
  • Monthly outlook: bias higher.
  • ES Fantasy Trader remains short at 1643.00.
Recap

The market continued trading sideways on Wednesday and while the Dow and SPX both posted small losses, they weren't enough to establish a new downtrend.  So we're closing out July in a similar situation to that which we found at the beginning of the month.  The hard part is figuring out if it will resolve the same way, upwards, but the charts will help us figure out the answer tot that one.

The technicals (daily)

The Dow: On Wednesday the Dow lost 25.5 points.  While that's not that much, the candle was bearish engulfing and it brought us very close to the edge of the rising RTC.  With indicators still slowly coming down off overbought, this chart now looks bearish.

The VIXAnd the VIX finally managed to string together two consecutive up days with a 4.11% advance on Wednesday.  This ended just outside the descending RTC for a bullish setup and caused the stochastic to form a bullish crossover so more upside is likely here on Thursday.

Market index futures: Tonight the futures are mixed once again at 12:48 AM EDT with ES down by 0.07%, YM down 0.07% but NQ up 0.11%.  Last night I wrote "this chart may be headed lower on Wednesday" and sure enough, down we went on a tall spinning top that dropped us out of the rising RTC for a bearish setup.  The overnight so far is a bullish hammer but one must remember that from half-baked candles come half-baked predictions.  So as long as we remain in a descending RTC with falling indicators and no nearby support, this chart remains bearish.

ES daily pivot: Tonight the pivot steps down from 1689.92  to 1685.42.  This means we remain below the new pivot, though now by less than three points.  On the face of it, this is bearish, but watch for any attempt to cross the pivot in the wee hours of Thursday morning.

Dollar index: The dollar broke out of its descending RTC on Wednesday for a bullish setup with a 0.44% gain.  Add in a bullish one white soldier candle and indicators that remain oversold and it looks like the dollar could go higher again on Thursday.

Euro: On Wednesday the euro put an end to its recent advance as the three white soldiers threw down their weapons and surrendered with a bearish harami.  But the overnight is regaining some ground, up 0.08% so far.  I think this one will depend on whether or not we can cross the pivot, now at 1.3212.  The euro is closing in on that as I write.

Transportation: Last night I wrote "the stars are aligning for lower here on Wednesday" and sure enough, we lost another 1.12%.  With three days of steepening losses, this chart is going exponential to the downside, suggesting that a reversal isn't too far off.  There's also support just below us at 6426  and the indicators are now halfway to oversold.  So we likely have at least some more downside here on Thursday and then we'll have to see about Friday.


Accuracy (daily calls):

Month     right wrong  no call  conditional  batting   Dow
                                             average  points

January    5      7      6           3        0.533   -101
February   3      4      5           6        0.692    131
March      5      7      5           2        0.500    121
April      7      5      5           3        0.667    328
May        3      4      6           4        0.636     85

June       6      5      6           0        0.545    543

July       9      1      2           3        0.923    496


     And the winner is...

I've grown wary of making calls for down days recently because the larger trend has been persistently higher, but tonight I have to say that I'm seeing all bearish charts with a picture that has been weakening for several days now.  So I'll just have to ignore my feelings and appeal to logic.  And right now, logic says Thursday lower.

ES Fantasy Trader

Portfolio stats: the account remains at $115,000 even after 14 trades (11 for 14 total, 6 for 6 longs, 5 for 8 short) starting from $100,000 on 1/1/13.  Tonight we remain short at 1643.00.  At least we regained some ground here on Wednesday..

Wednesday, July 24, 2013

Wednesday uncertain

The Hoot 
Actionable ideas for the busy trader delivered daily right up front
  • Wednesday uncertain.
  • ES pivot 1689.92.  Holding below is bearish.
  • Rest of week bias uncertain technically.
  • Monthly outlook: bias higher.
  • ES Fantasy Trader remains short at 1643.00.
Recap

We got our first down day on the SPX in a week, just barely, though the Dow did manage a modest 22 point gain on Tuesday.  Still, this sort of action has to make me wonder once again if we're not due for a move lower soon.  But instead of merely guessing, let's analyze the charts - and then guess :-)

The technicals (daily)

The Dow: It seems to be just one reversal warning after another on the Dow.  Last three days: hanging man, star, and today inverted hammer.  And none of them have come to anything as we continue to grind slowly higher, up another 0.14% on Monday.  (And BTW, if you're following my daily call accuracy list below, it's based on the results of the Dow, so Tuesday was a hit).  The chart appears to be sagging a bit but we remain in a rising RTC so I still can't really call this chart lower just yet.

The VIXAnd what of the all-important VIX?  Well here's something interesting - after being down three of the last four the VIX finally posted a non-trivial 3.01% gain on Tuesday with a classical bullish piercing pattern.  And VVIX put in a bullish engulfing pattern.  So despite remaining in a descending RTC, this is the perkiest news I've seen for the VIX lately.  I'd not be surprised to see th3e VIX move higher on Wednesday.  Oh, and Tuesday;'s low was right at support of 12.09, and that held up nicely.  And I note that VVIX put in a bullish engulfing pattern too.

Market index futures: Tonight all three futures are decidedly mixed at 1:00 AM EDT with YM up by all of one tick, ES down one tick and NQ marching to its own drum, up a healthy 0.45%.  After putting in a star on Monday, ES confirmed it as it moved lower on Tuesday with a red spinning top that just broke out of the rising RTC for a bearish setup.  And despite a rally attempt right after Tuesday's close, ES is fading in the overnight.  This is all a type of action we've not been seeing during the rally that began Jun 25th.  Indicators continue to come off overbought too so I'm thinking now that this chart may be headed lower on Wednesday.

ES daily pivot: Tonight the pivot barely moves from 1690.00  to 1689.92.  After threading about the old number all day long on Tuesday, it looks like ES has now decided to remain below the new level so this indicator becomes bearish.

Dollar index: On Tuesday the dollar posted its fourth consecutive loss, down another 0.34% and rapidly closing in on the 200 day MA at 55.97 on the $USDUPX. (a number that coincides with the lower BB).  So with a steep downtrend in place, I see no signs of a reversal for the dollar on Wednesday.

Euro: The euro managed to make it three in a row on Tuesday for a bullish three white soldier pattern.  However, the overnight is sinking to a greater degree than we've seen at this hour of the night lately, down 0.19% at this point.  So it's possible we could see a pullback here on Wednesday, though this is far from certain.

Transportation: If you believe in Dow Theory (and I do), then Tuesday's action is somewhat concerning, as the trans dropped a significant 0.95% on a day the Dow gained 0.14%.  This dropped them out of the latest rising RTC for a bearish trigger.  It also completed a bearish stochastic crossover.  With indicators remaining overbought, it looks like the stars are aligning for lower here on Wednesday.


Accuracy (daily calls):

Month     right wrong  no call  conditional  batting   Dow
                                             average  points

January    5      7      6           3        0.533   -101
February   3      4      5           6        0.692    131
March      5      7      5           2        0.500    121
April      7      5      5           3        0.667    328
May        3      4      6           4        0.636     85

June       6      5      6           0        0.545    543

July       9      1      1           3        0.923    496


     And the winner is...

I began noticing a few bearish signs a couple of days ago.  They're becoming a bit more pronounced tonight, though not by much.  But I do note that the market New High-New Low ratio hit 91:9 on Tuesday, and that's getting pretty overextended.  Dr. Brett Steenbarger often made note of this one.  Unfortunately, the pattern recently has been a "sneeze market".  It starts going "ahh... ahhh" and everyone's waiting for the "choo!" only it never comes.  So while it looks like the current advance has stalled out a bit, it's also not a sure bet to go lower, from what I can see tonight.  Therefore, the only logical call is for Wednesday uncertain.

ES Fantasy Trader

Portfolio stats: the account remains at $115,000 even after 14 trades (11 for 14 total, 6 for 6 longs, 5 for 8 short) starting from $100,000 on 1/1/13.  Tonight we remain short at 1643.00.  Nothing new here.

Tuesday, July 23, 2013

Tuesday higher

The Hoot 
Actionable ideas for the busy trader delivered daily right up front
  • Tuesday higher, low confidence.
  • ES pivot 1690.00 .  Holding above is bullish.
  • Rest of week bias uncertain technically.
  • Monthly outlook: bias higher.
  • ES Fantasy Trader remains short at 1643.00.
Recap

Hmm - it's starting to look from Monday's results that this rally might just finally be running out of gas.  On the other hand, we've seen this movie before and it didn't pan out.  So which is it - is this yet another fake-out pseudo-top or are we really at long last ready for the pullback everyone's been waiting for.  Only the charts can say, so let's take a gander at them without further delay.

The technicals (daily)

The Dow: The Dow appears to have fallen back into the had to call small-range sideways action that bedeviled us last week, gaining all of 1.81 points on Monday with a perfect doji star.  Since the indicators have already begun moving lower off extreme overbought levels, I'm more inclined to give some credence to this reversal warning.  But given the recent lousy track record of dojis here, I can't call the Dow lower without confirmation on Tuesday.

The VIXThe VIX fell again on Monday, down another 1.99% to give us two overlapping red candles.  There are a number of bullish reversal patterns that start this way, but they're all three-candle patterns, so we need one more day to call a reversal.  In the meantime the indicators are just barely oversold, there's no support until 12, the lower BB keeps falling away, now down to 11.37, and VVIX also shows no signs of a reversal, so there's definitely still room to run lower here.

Market index futures: Tonight all three futures are once again higher at 1:04 AM EDT with ES up by 0.25%.  After a perfect star on Monday, the overnight has resumed its march higher to remain easily inside its rising RTC.  And while RSI remains overbought even as it inches lower, the stochastic is forming a little concavity at a high level indicative of further upside to come.  So I don't really see anything bearish here tonight.

ES daily pivot: Tonight the pivot rises again from 1685.08  to 1690.00 even.  And once again, we remain above the new pivot, so this indicator remains bullish.

Dollar index: The dollar continued its choppy move lower with another gap down on Monday for a 0.48% loss ending with a hammer.  With the indicators now appearing to have bottomed at oversold, we have at least a suggestion of a move higher on Tuesday.

Euro: Meanwhile the euro put in a second day of gains to close at 1.3192 on Monday.  And we're continuing higher from there in the overnight, now up another 0.08%.  With the upper BB providing the next meaningful stopping point at 1.3264, there's still some room to run here on Tuesday.  And I like those odds better than the dollar's moving higher, so maybe my dollar call is wrong.

Transportation: For the third day in the row, the trans were unable to pass the 6608 level and in fact formed a bearish dark cloud cover on a 0.13% loss Monday.  Indicators remain quite overbought and with what's now looking like a sideways ricochet off the upper BB, a move lower looks likely from here.

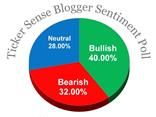
Sentiment: Once again it's time for the latest weekly TickerSense Blogger Sentiment Poll.  We continue to track the poll to see how well it performs.  Note that I've corrected the data in the accuracy columns due to a mistake I made in week 13 but only just noticed now.

Wk.# Week   % Bullish  % Bearish  NightOwl Poll SPX  Accuracy Poll

  1  12/31      40         48        -      -   1402   0/1
  2  1/7        47         30        +      +   1466   1/2
  3  1/14       52         15        +      +   1472   2/3
  4  1/22       50         21        +      +   1486   3/4
  5  1/28       44         26        +      +   1503   4/5
  6  2/5        40         36        +      +   1513   5/6
  7  2/11       43         25        +      +   1518   6/7
  8  2/19       21         43        -      -   1520   6/8
  9  2/25       30         52        -      -   1516   6/9
 10  3/4        29         39        -      -   1518   6/10
 11  3/11       41         26        +      +   1551   7/11
 12  3/18       41         37        +      +   1561   8/12
 13  3/25       31         38        +      -   1557   8/13    9/13
 14  4/1        38         38        +      x   1569   9/14    9/13
 15  4/8        32         50        -      -   1553   9/15    9/14
 16  4/15       33         50        +      -   1589   10/16   9/15
 17  4/22       19         63        -      -   1555   10/17   9/16
 18  4/29       33         58        -      -   1582   10/18   9/17
 19  5/6        50         31        +      +   1614   11/19  10/18
 20  5/13       37         37        +      x   1634   12/20  10/18
 21  5/20       50         25        +      +   1667   12/21  10/19
 22  5/28       37         33        +      +   1650   12/22  10/20
 23  6/3        29         38        -      -   1631   13/23  11/21
 24  6/10       38         38        +      x   1643   13/24  11/21
 25  6/17       32         40        +      -   1627   14/25  11/22
 26  6/24       13         46        -      -   1592   14/26  11/23
 27  7/1        25         42        -      -   1606
 28  7/8        42         29        +      +   1632
 29  7/15       48         22        +      +   1680
 30  7/22       42         19        +      +   1692 

Again, the SPX number is the closing price of the S&P on the Friday before each new poll comes out.  The "NightOwl" column is how I voted.  The "Poll" column is how the majority of participants voted.  Since the poll is for 30 days out, after the first four weeks we're able to see how well we did.  This week we see that both I and the majority of the poll voted bullish  four weeks ago, so we were all wrongTherefore we  continue the year with an accuracy of 14  for 26, or 54%.   The poll as a whole drops to 11 for 23 or 48%.  We are now, embarrassingly enough, in coin-flipping territory as far as accuracy goes.


This week I voted bullish once again, as did the majority of the poll.  I'm looking at weekly and monthly SPX charts and candlestick-wise there's not a bearish sign to be found.

Accuracy (daily calls): 

Month     right wrong  no call  conditional  batting   Dow
                                             average  points

January    5      7      6           3        0.533   -101
February   3      4      5           6        0.692    131
March      5      7      5           2        0.500    121
April      7      5      5           3        0.667    328
May        3      4      6           4        0.636     85

June       6      5      6           0        0.545    543

July       8      1      1           3        0.917    474


     And the winner is...

Tonight I'm only seeing one bit of bearishness, on the trans chart.  Everything else is either indecisive or bullish, so the balance of the argument goes to the bulls.  Therefore I call Tuesday higher.

ES Fantasy Trader

Portfolio stats: the account remains at $115,000 even after 14 trades (11 for 14 total, 6 for 6 longs, 5 for 8 short) starting from $100,000 on 1/1/13.  Tonight we remain short at 1643.00.  Nothing new here.

Monday, July 22, 2013

Monday higher

The Hoot 
Actionable ideas for the busy trader delivered daily right up front
  • Monday higher, low confidence.
  • ES pivot 1685.08.  Holding above is bullish.
  • Rest of week bias uncertain technically.
  • Monthly outlook: bias higher.
  • ES Fantasy Trader remains short at 1643.00.
Recap

Well I picked a good day to travel as nothing much happened in the markets on Friday with the Dow ending down all of five points.  So does this mean anything for Monday?  Let's check the charts.

The technicals (daily)

The Dow: On Friday the Dow failed once again to advance beyond the 15,545 level and closed with a small loss for a hanging man.  This is technically bearish but requires confirmation on Monday so we can't read too much into it, especially coming as it did on an op-ex Friday.

The VIXWhat was most interesting on Friday (to my surprise as I was traveling all day) was that while the market was little changed, the VIX dropped nearly 9%, its biggest loss since June 13th.  This completely demolished the support at 13.53 and left the VIX to close at 12.54, right above its next support level of 12.41.  And with a bearish stochastic crossover plus a lower BB falling away and now down to 11.64, it looks like the VIX could well go lower again on Monday.

Market index futures: Tonight all three futures are modestly higher at 12:18 AM EDT with ES up by 0.09%.  After some indecision last Wednesday and Thursday on rising candles, ES put in a big advance on Friday totally canceling last week's bearish RTC exit.  In fact we now have a new rising RTC.  And this chart continues to look bullish.  The indicators remain pegged on overbought and so have no predictive power.  I'm hard-pressed to find anything bearish on this chart.

ES daily pivot: Tonight the pivot notches up from 1680.25  to 1685.08. We remain above the new pivot with little indication of a desire to test it, so that is a positive sign for Monday.

Dollar index: The dollar continued its recent erratic moves on Friday, ending down 0.29% after a series of spinning tops.  The dollar remains oversold but I see little in the way of any trend or reversal signs so I'm not touching this chart tonight.

Euro: The euro is, not surprisingly, similarly conflicted, putting in a green spinning top on Friday and advancing further in the overnight but still unable to crack resistance at 1.3163.  We also have indicators coming down off overbought so my wild guess would be that the euro could move lower on Monday, but I don't have much confidence in that.

Transportation: On Friday the trans gave us a small 0.11% advance on a classic spinning top that peeled off the upper BB.  With overbought indicators, this now suggests the possibility of a move lower, but one that requires confirmation on Monday.  So we can't call this one yet.


Accuracy (daily calls):

Month     right wrong  no call  conditional  batting   Dow
                                             average  points

January    5      7      6           3        0.533   -101
February   3      4      5           6        0.692    131
March      5      7      5           2        0.500    121
April      7      5      5           3        0.667    328
May        3      4      6           4        0.636     85

June       6      5      6           0        0.545    543

July       7      1      1           3        0.909    472


     And the winner is...

I've been wanting to call the market lower several times lately but it's just not happening.  And while once again there are a few reversal warnings on the charts, I see no real red flags and in fact a fair amount of continued bullish signs so the only logical call is for Monday higher.

ES Fantasy Trader

Portfolio stats: the account remains at $115,000 even after 14 trades (11 for 14 total, 6 for 6 longs, 5 for 8 short) starting from $100,000 on 1/1/13.  Tonight we remain short at 1643.00.  Nothing new here.